Biacore® instruments can be used to determine if two analytes bind to the same or to different sites on a particular ligand. These studies utilize sequential binding paradigms to determine if binding of the first analyte occludes binding of the second or third analyte.
In the following example, a ligand was directly coupled to the surface of a CM5 chip and then different monoclonal antibodies generated against the ligand protein were added sequentially. The first antibody (Ab1: black arrows) required several doses over time to reach binding that was close to saturation, at which point it fully inhibited the ability of a second antibody to bind (Ab2: blue arrow), but not a third (Ab3: red arrow). Note that both Ab1 and Ab3 each give responses of ~30 RU, indicating that they bind to the same number of sites on the ligand.

The results suggest that, as Ab1 and Ab2 compete for binding, they share a binding site on the antigen, but that, as Ab1 does not affect binding of Ab3, Ab3’s binding site is distinct.
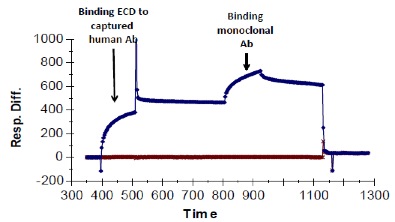
Sequential binding assays to test for competitive binding can also be done after indirect capture, with antibodies generated in different species. In the following example, a human antibody to the ECD of a membrane-bound receptor was used to capture the ECD, and then a second, monoclonal antibody to that same ECD was added. If the two antibodies bound to the same site, no binding of the second antibody would be observed (assuming the ECD is monomeric, which it is). If the two antibodies bound to different sites, then the second, monoclonal antibody should bind, and this should register as a clear increase in RUs. The latter is the case.
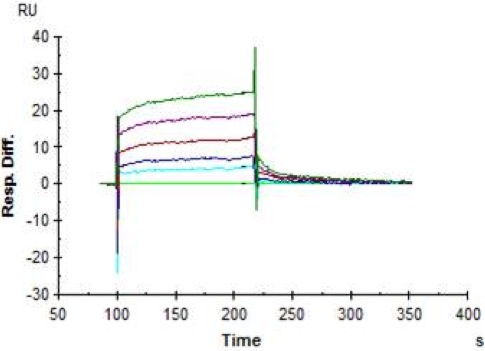
When two antibodies can bind simultaneously, sequential binding studies can also be used to determine the kinetics of binding of the second, even when the affinity is poor or more direct binding studies are unsuccessful. When we tried to measure the binding of the monoclonal antibody to the ECD by capturing the antibody indirectly on an anti-mouse chip and then using the ECD as analyte, we were unable to do so. Remarkably, using this sequential paradigm we were able to measure binding: kinetic analysis of the binding of the monoclonal antibody to the bound ECD (curves generated at different concentrations of monoclonal antibody are shown below) yielded a KD of approximately 150 nM. The fit of the data was excellent (Chi2 = 0.31).