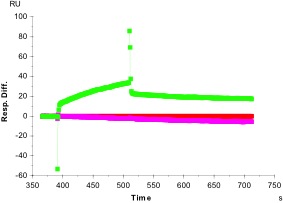
The first step in using Biacore® instrumentation to measure binding is to determine if binding between two molecules can be detected. This is termed “yes-no” binding.
Once the chip is charged, either by direct or indirect coupling, it is ready to test with analyte. Analyte is flowed over the chip surface and the resulting SPR signal is compared to the signal generated when only inert buffer is introduced. In the following example, the green curve represents an analyte that binds to the charged chip surface (its signal is significantly above buffer alone, shown in red), whereas the pink curve represents an analyte that does not (its signal is actually below buffer alone).

The results show “yes” binding for the analyte shown in green, “no” for the analyte shown in pink. Red shows the buffer control.
