Once the Yes-No binding step has established that specific binding does indeed occur and we have optimized conditions for measuring binding, we can study the kinetics of binding. The data generated include the kinetic rate constants for association (kon, in units of M-1 •sec-1) and dissociation (koff, in units of sec-1), and the equilibrium constants for binding, expressed either as KA (units, M-1) or KD (units, M). We routinely use KD. In this experiment, typically a relatively small amount of ligand (100 – 200 RU) is captured directly or indirectly onto the chip. Different concentrations of analyte are then introduced and binding and dissociation are measured in real time.
In the following example, we assayed binding of a mouse monoclonal antibody (ML = 150 kDa), captured indirectly on a CM5 chip at a level of 140 RU, to a purified protein comprising the extracellular domain (ECD) of a membrane-bound receptor (MA = 100 kDa). After capture of the antibody, solutions of increasing concentrations of the ECD analyte were introduced. The calculated Rmax was 188.
The results (colored curves) were fitted with BiaSimulation software (“Evaluating the Data“) to give a value for KD of 2.1 nM, and values for kon and koff of 3.6•105 M-1 •sec-1 and 7.7•10-4 sec-1, respectively. The fit is excellent (Chi2 = 0.33).
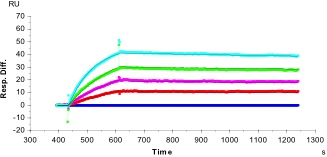
[Note that, in this experiment, the actual Rmax measured in this experiment, 32 RU, was only 17% of the calculated Rmax. This indicates that only 17% of the monoclonal antibody captured on the surface of the chip was active.]